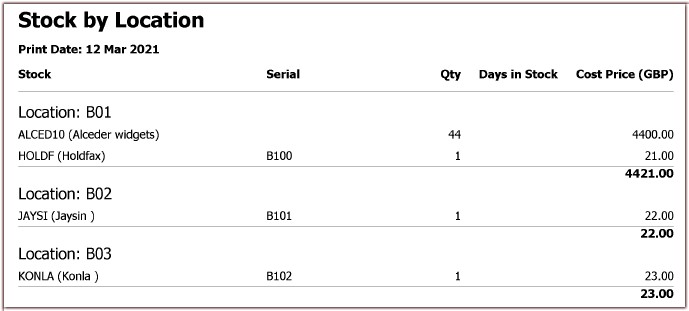
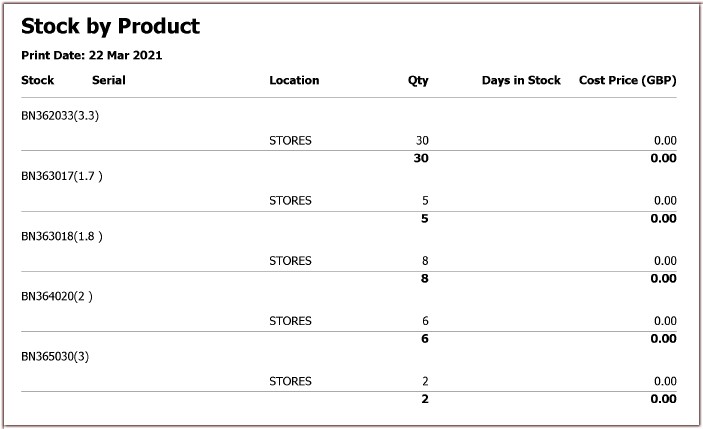
Here are a few of the management reports that give a complete picture of the current situation and the history of the stock moving through the warehouse. The amount in stock and where it is in the warehouse is shown in the tow reports Stock by product and stock by location. The columns showing the cost price give an indication of the value held in each location and the overall value of the stock holding for each product. Where the same stock is held in more that one location it is grouped in the Stock by product report. Where a location contains more than one type of stock this is grouped in that location.
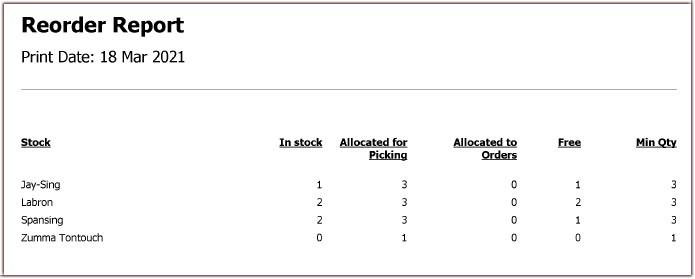
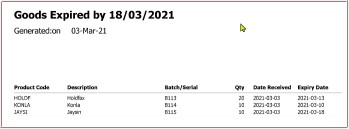
The reorder report not only supplements the visual on screen yellow flag warning but also generates supplier orders where standard suppliers have been defined for the product. The Expired goods report is supplementary to the reorder report so that decisions can be made on additional stock to reorder.
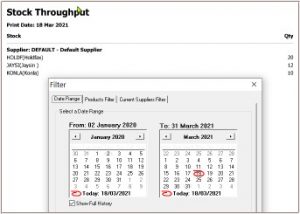
Stock turnover shows which products move fastest and the filters enable you to see time periods in relation to stock sales.
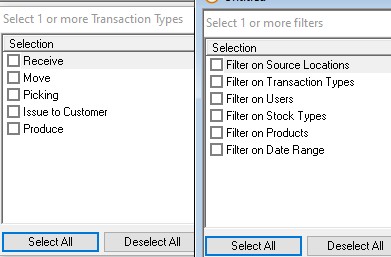
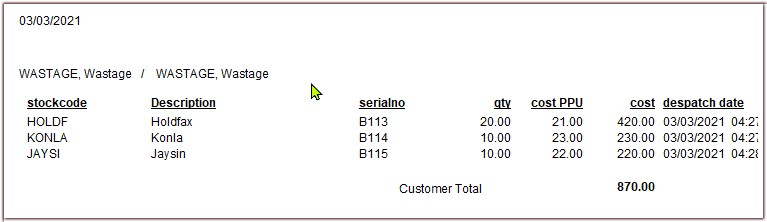
The transactions histories have a large number of filters that enable you to drill down to either product code over a time period or transaction types like Receive or Pick.